 Physix Frontier
You have all the materials, but still can't write the PPT? I had AI make a 5-page report

Data is in spreadsheets, work logs are written, but when it's time to present, I still don't know what to put on the first slide.
Pasting the whole table looks like listing transactions; asking AI to "write it professionally" risks it inventing achievements not in the materials.
This time, I made a 5-slide PPT from a store activity data sheet, focusing on two things: What happened this week, and what we plan to do next week.
First, let's look at the final draft.
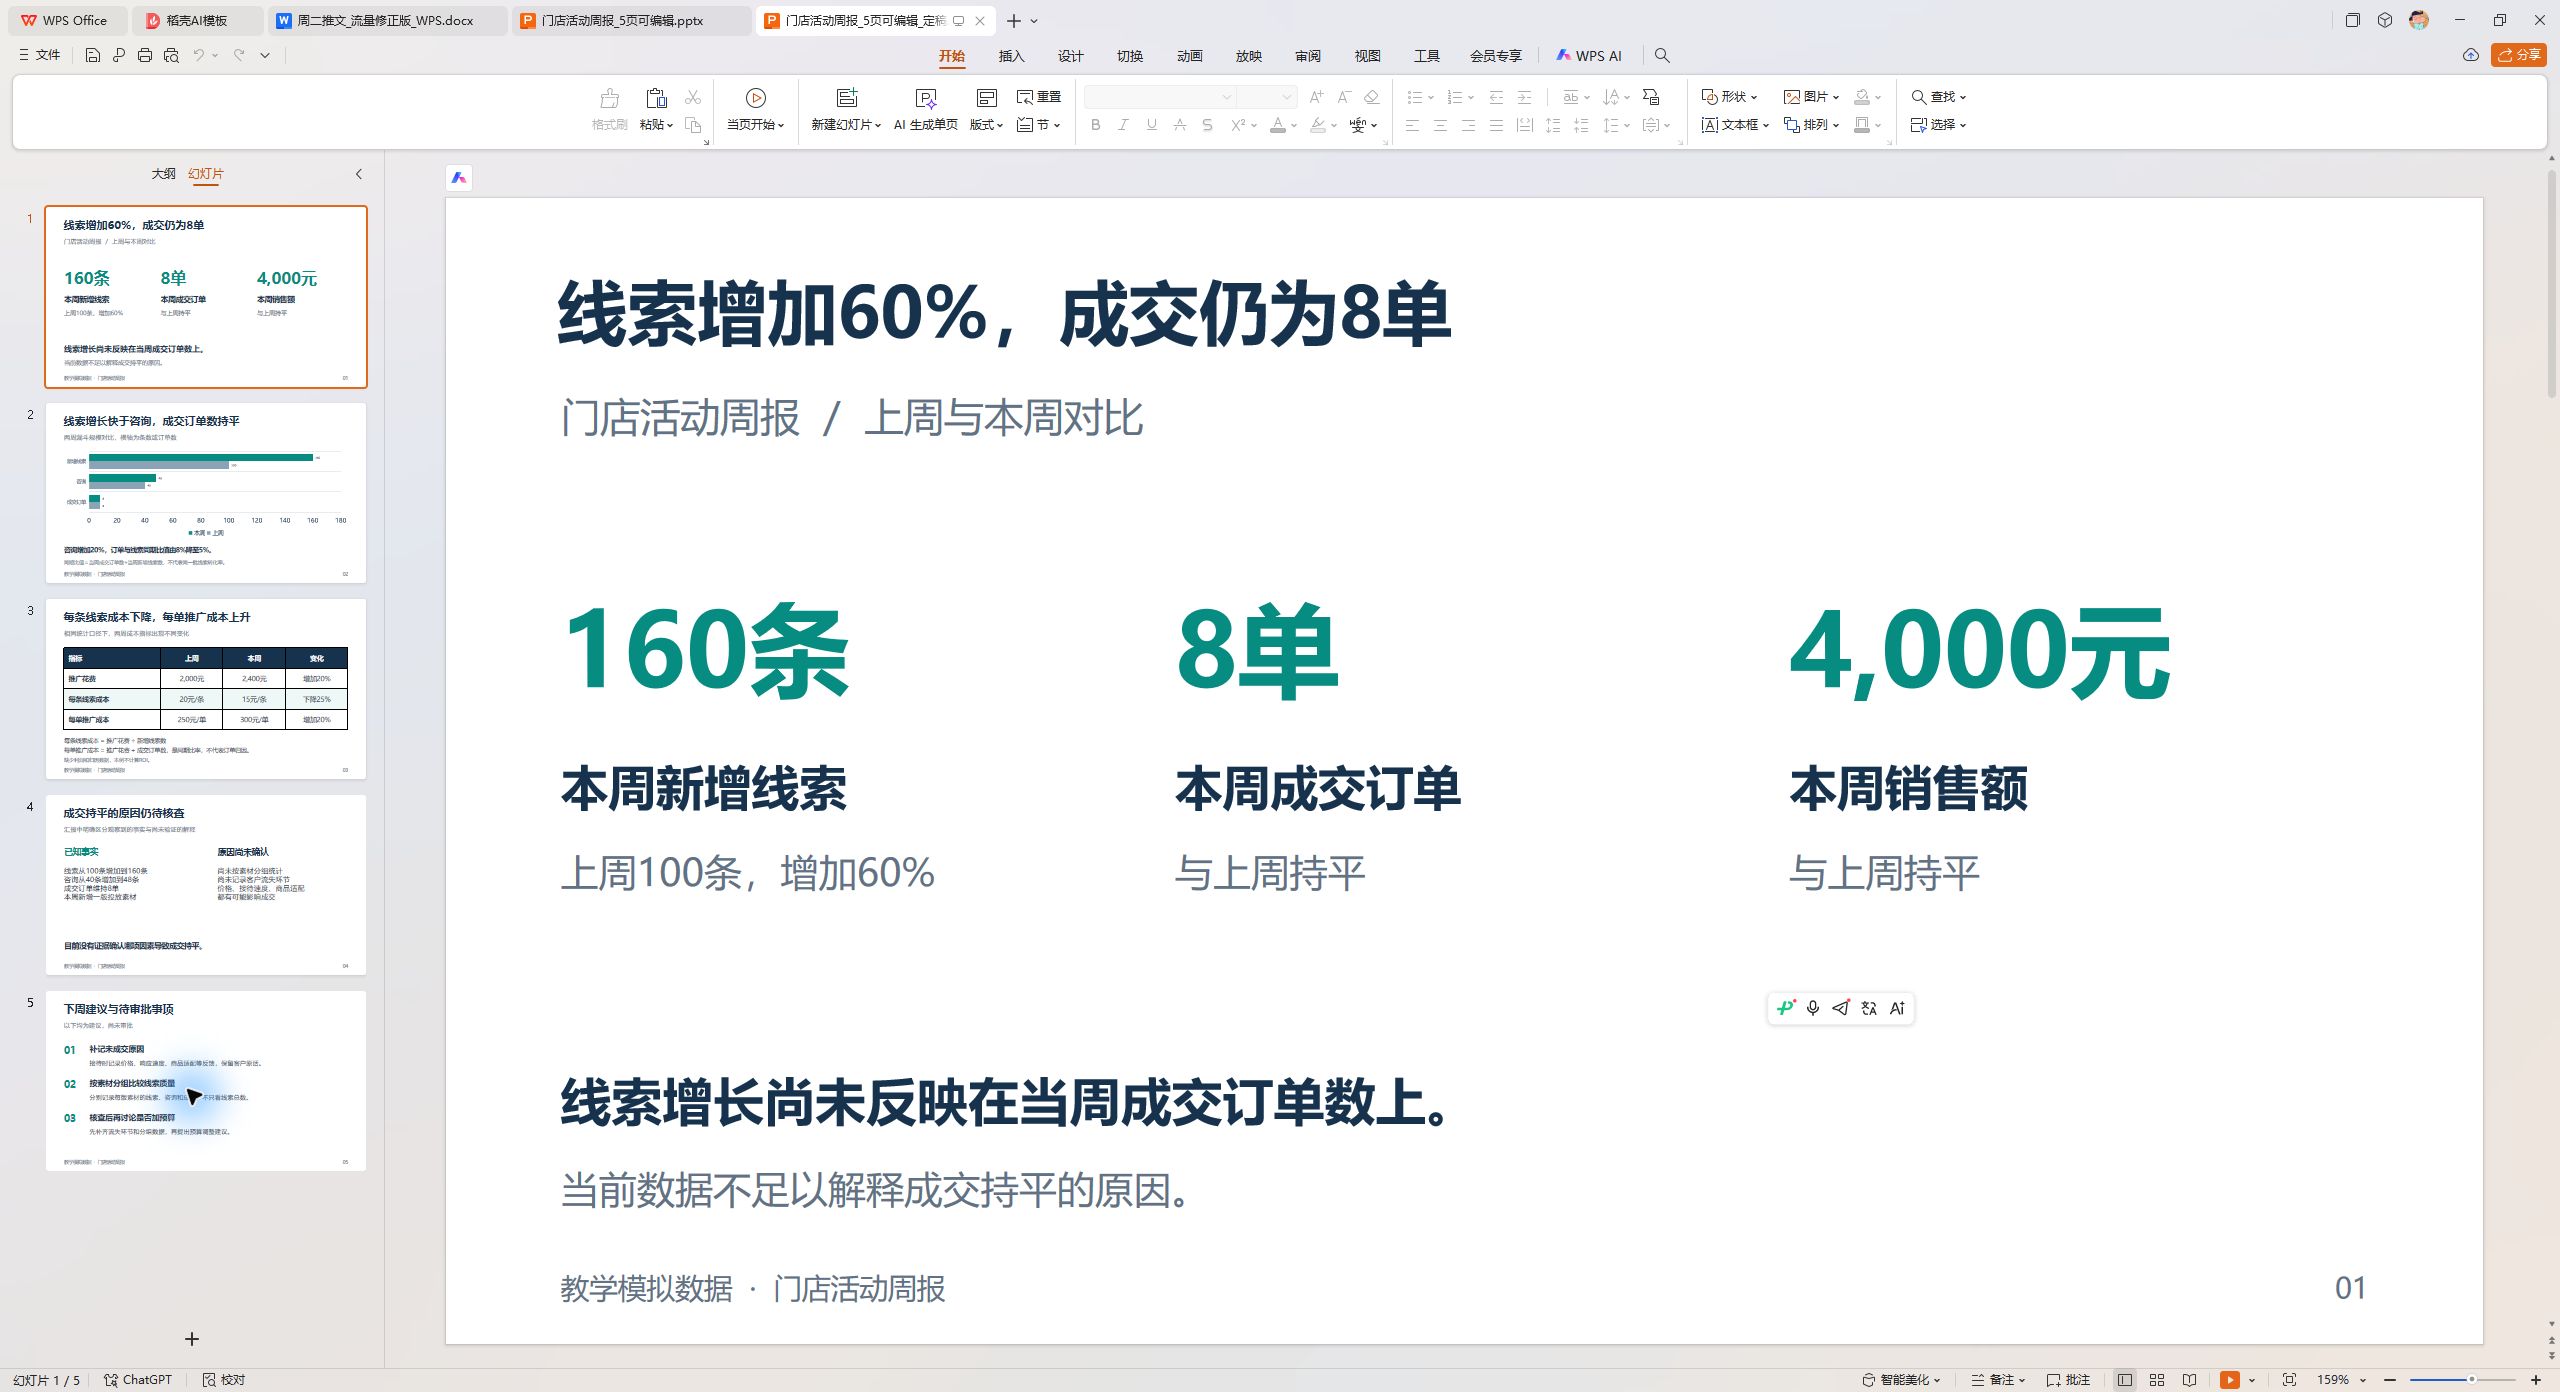
Figure 1 | Actual interface of the generated file opened in WPS. All business data is for educational simulation.
This example was generated by Codex, and I verified it in WPS. You can swap the requirements below with your own work materials and give them to the AI you're using. Generating the file requires tools that support exporting editable PPTX; if it only returns text, you still need to build it.
First Determine What This Report Needs to Answer
Assume I'm responsible for store activity promotion, and this week's data is:
Metric
Last Week
This Week
Exposure
8000
10000
New Leads
100
160
Consultations
40
48
Closed Orders
8
8
Sales Revenue
4000 Yuan
4000 Yuan
Promotion Cost
2000 Yuan
2400 Yuan
This is fictional data prepared specifically for the tutorial, no real customer data was used.
If the report goal is to discuss increasing the promotion budget next week, the first thing I need to say is: Leads increased by 60%, but closed orders remained at 8.
This is more specific than "Weekly Work Summary" and gives focus to the following content. Growth in exposure and leads is worth noting, but lack of growth in closed orders must also be addressed.
When doing your own reports, you can hand materials to AI and add this requirement:
Please prepare a work report for the department head based on the following materials.
The question to discuss is: Should we increase the promotion budget next week?
First provide one core conclusion, supporting data, and things that cannot yet be confirmed.
List calculation formulas, clearly marking last week vs. this week.
Use only the facts I provide. If there is no root cause analysis material, write "Cause pending investigation."
Output text content first; I will review before creating the PPT.
For administrative reports, change the question to "Which items need coordination from the person in charge this month?"; for sales reports, change it to "Which customers need priority follow-up?" Clarifying the audience and question helps decide which materials to keep.
I Used 5 Slides to Tell a Complete Story with Data
This example didn't include a title-only cover slide. Slide 1 gives the conclusion directly, followed by details.
1. This Week's Result: Leads up 60%, closed orders still 8.
2. Where the Change Happened: Compare leads, consultations, and closed orders together.
3. Did Spending Change? Compare promotion costs and two cost metrics.
4. What Can We Confirm Now: Which are data facts, which causes are still unknown.
5. Plan for Next Week: Add records, group comparisons, then discuss budget.
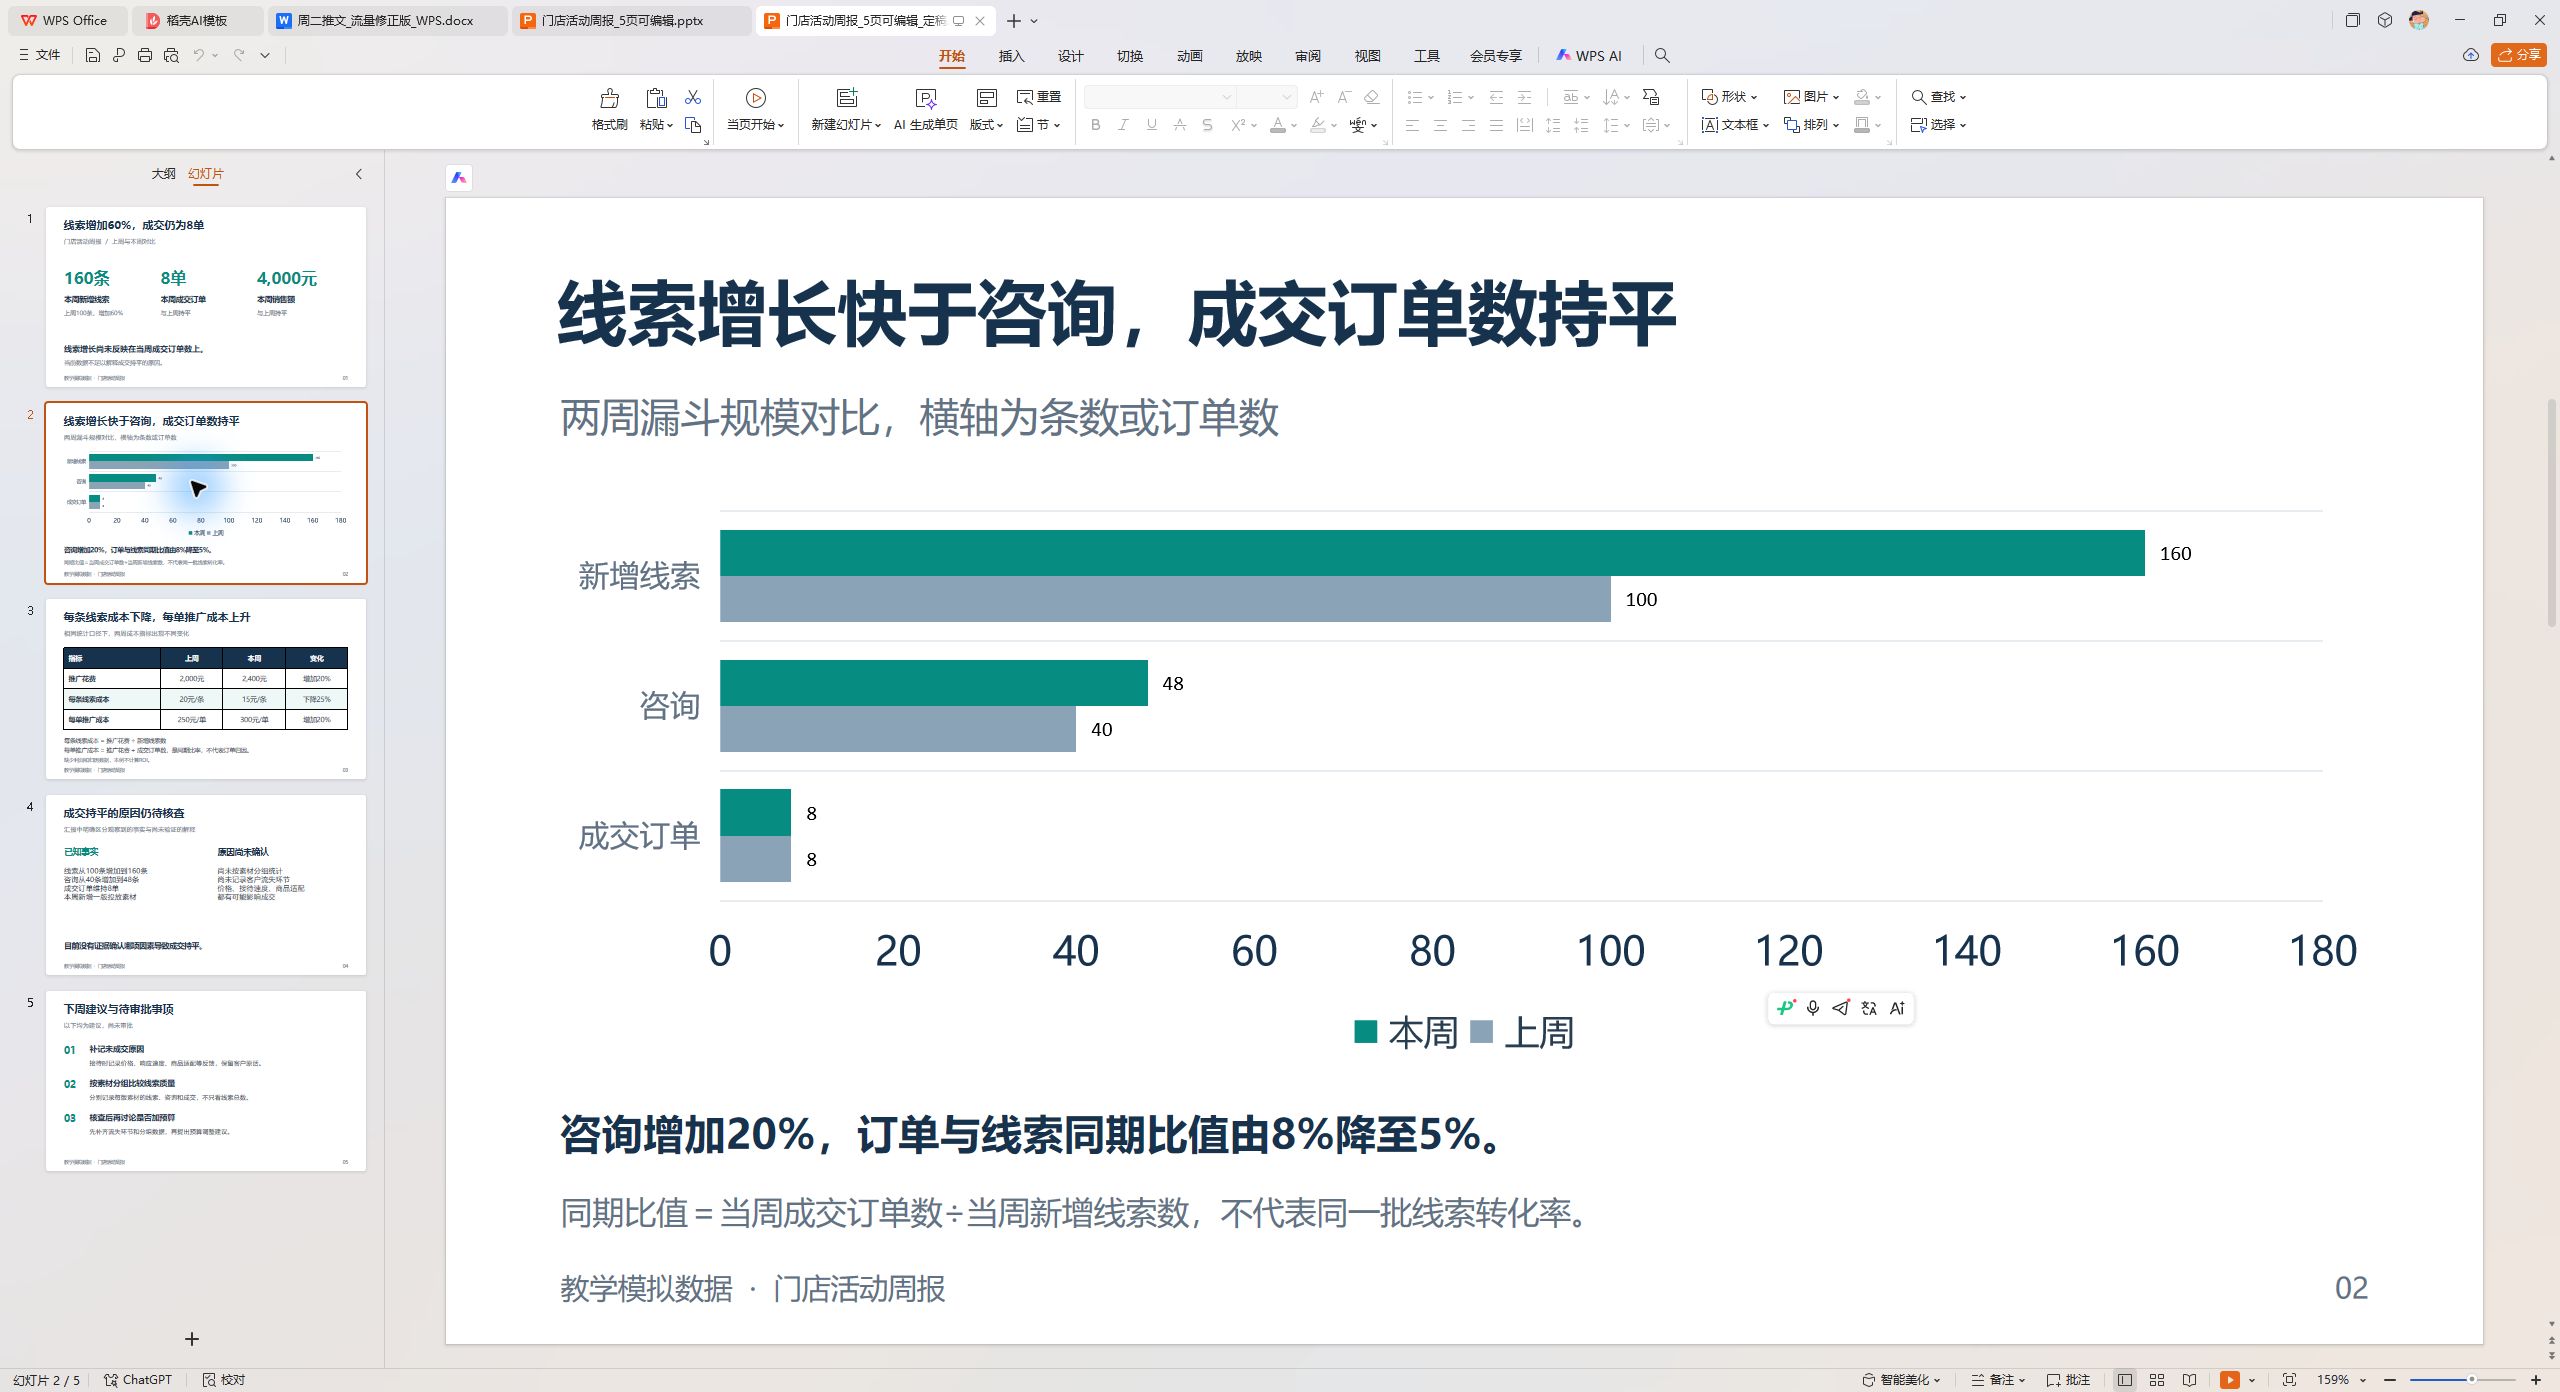
Figure 2 | Placing two weeks' data on the same page avoids readers flipping back and forth to compare numbers.
Here's an easily overlooked point. Leads went from 100 to 160, consultations from 40 to 48—don't summarize both as "significant growth." The former grew 60%, the latter 20%, and closed orders didn't change.
I write these differences on the slide. As for why conversion didn't happen—is it price, reception, or lead quality—the existing materials aren't enough to confirm.
So this slide can say "Need further investigation of conversion stages," but cannot directly say "Sales follow-up was untimely."
When Generating, Write "Editable" into the Requirements
After confirming content, arrange the slides. Use this prompt next:
Generate a 5-page Chinese PPTX based on the confirmed content.
Use 16:9 aspect ratio, white background, dark blue text, and slight teal highlights.
Each slide revolves around one question. Charts label two-week data, tables label currency units.
Text, tables, and charts must be editable in WPS or PowerPoint.
Do not turn entire slides into images, and do not replace raw data with placeholder numbers.
Keep markers for unconfirmed causes and suggestions.
Deliver a PPTX file; if any part is non-editable, explicitly point it out.
I kept the style simple this time, leaving ample space for conclusions, numbers, and necessary explanations. In work reports, others need to understand changes first before deciding next steps.
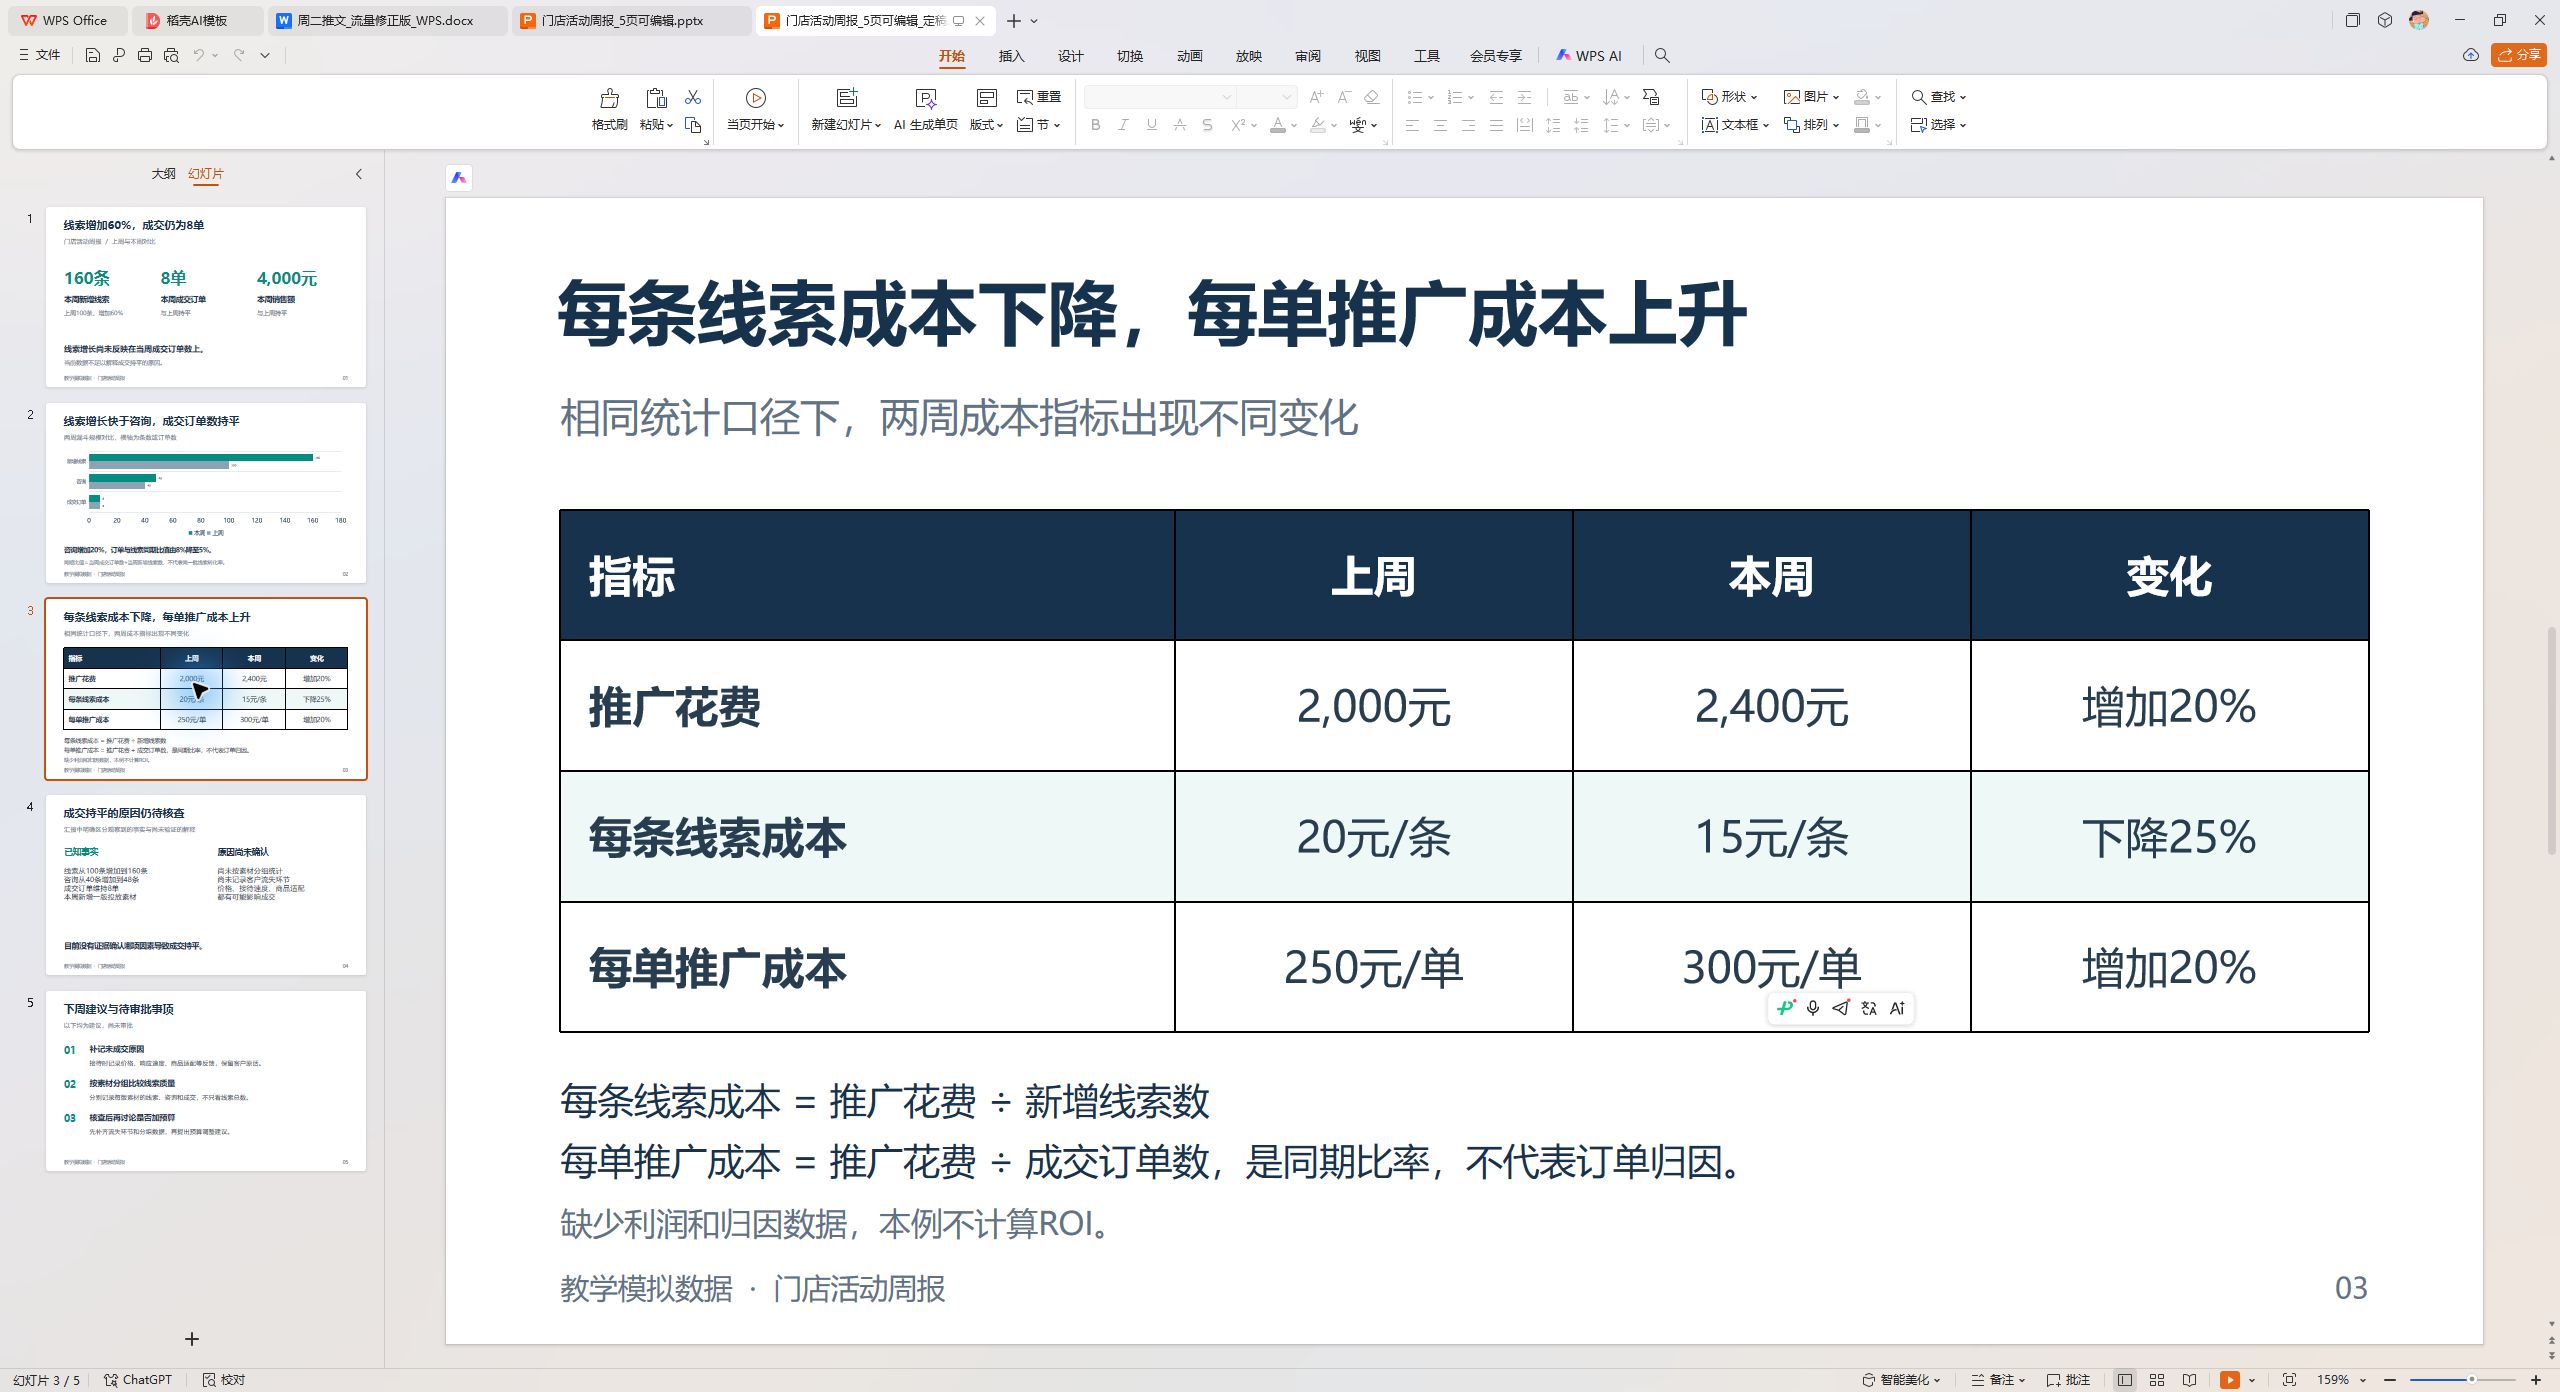
Figure 3 | Cost per lead and promotion cost per order use different denominators; don't mix them up.
This page is especially worth checking.
Last week's cost per lead was 2000÷100=20 Yuan, this week is 2400÷160=15 Yuan. Looks like acquiring leads got cheaper.
But calculating "Promotion Cost ÷ Closed Orders" for the same period, cost per order rose from 250 Yuan to 300 Yuan.
Both results can be true simultaneously. Picking only the 15 Yuan figure might make the report miss issues on the closing end. Note that this cost per order is just a same-period ratio, not tracking individual order sources, so it's not strict ad attribution.
Also, materials lack gross margin and other costs, so I won't calculate profit or ROI based on this.
After Opening the File, I Still Need to Be Able to Edit It
Once I get the PPTX, I first check if text displays normally in WPS, then select titles to ensure they are independent text objects.

Figure 4 | Titles can be selected individually; the page retains editable objects.
Next, I recalculate key numbers. In this example, the ratio of same-period closed orders to new leads changed from 8÷100=8% to 8÷160=5%, a difference of 3 percentage points. Since this sheet doesn't track how many leads from the same batch eventually closed, I label it "Same-period ratio" rather than direct customer conversion rate.
Finally, check the wording of suggestions. Since we haven't investigated causes yet, write next steps as "Record reasons for unclosed deals" and "Compare lead quality by asset group." Leave budget increases for discussion after investigation, ensuring suggestions don't look like approved decisions.
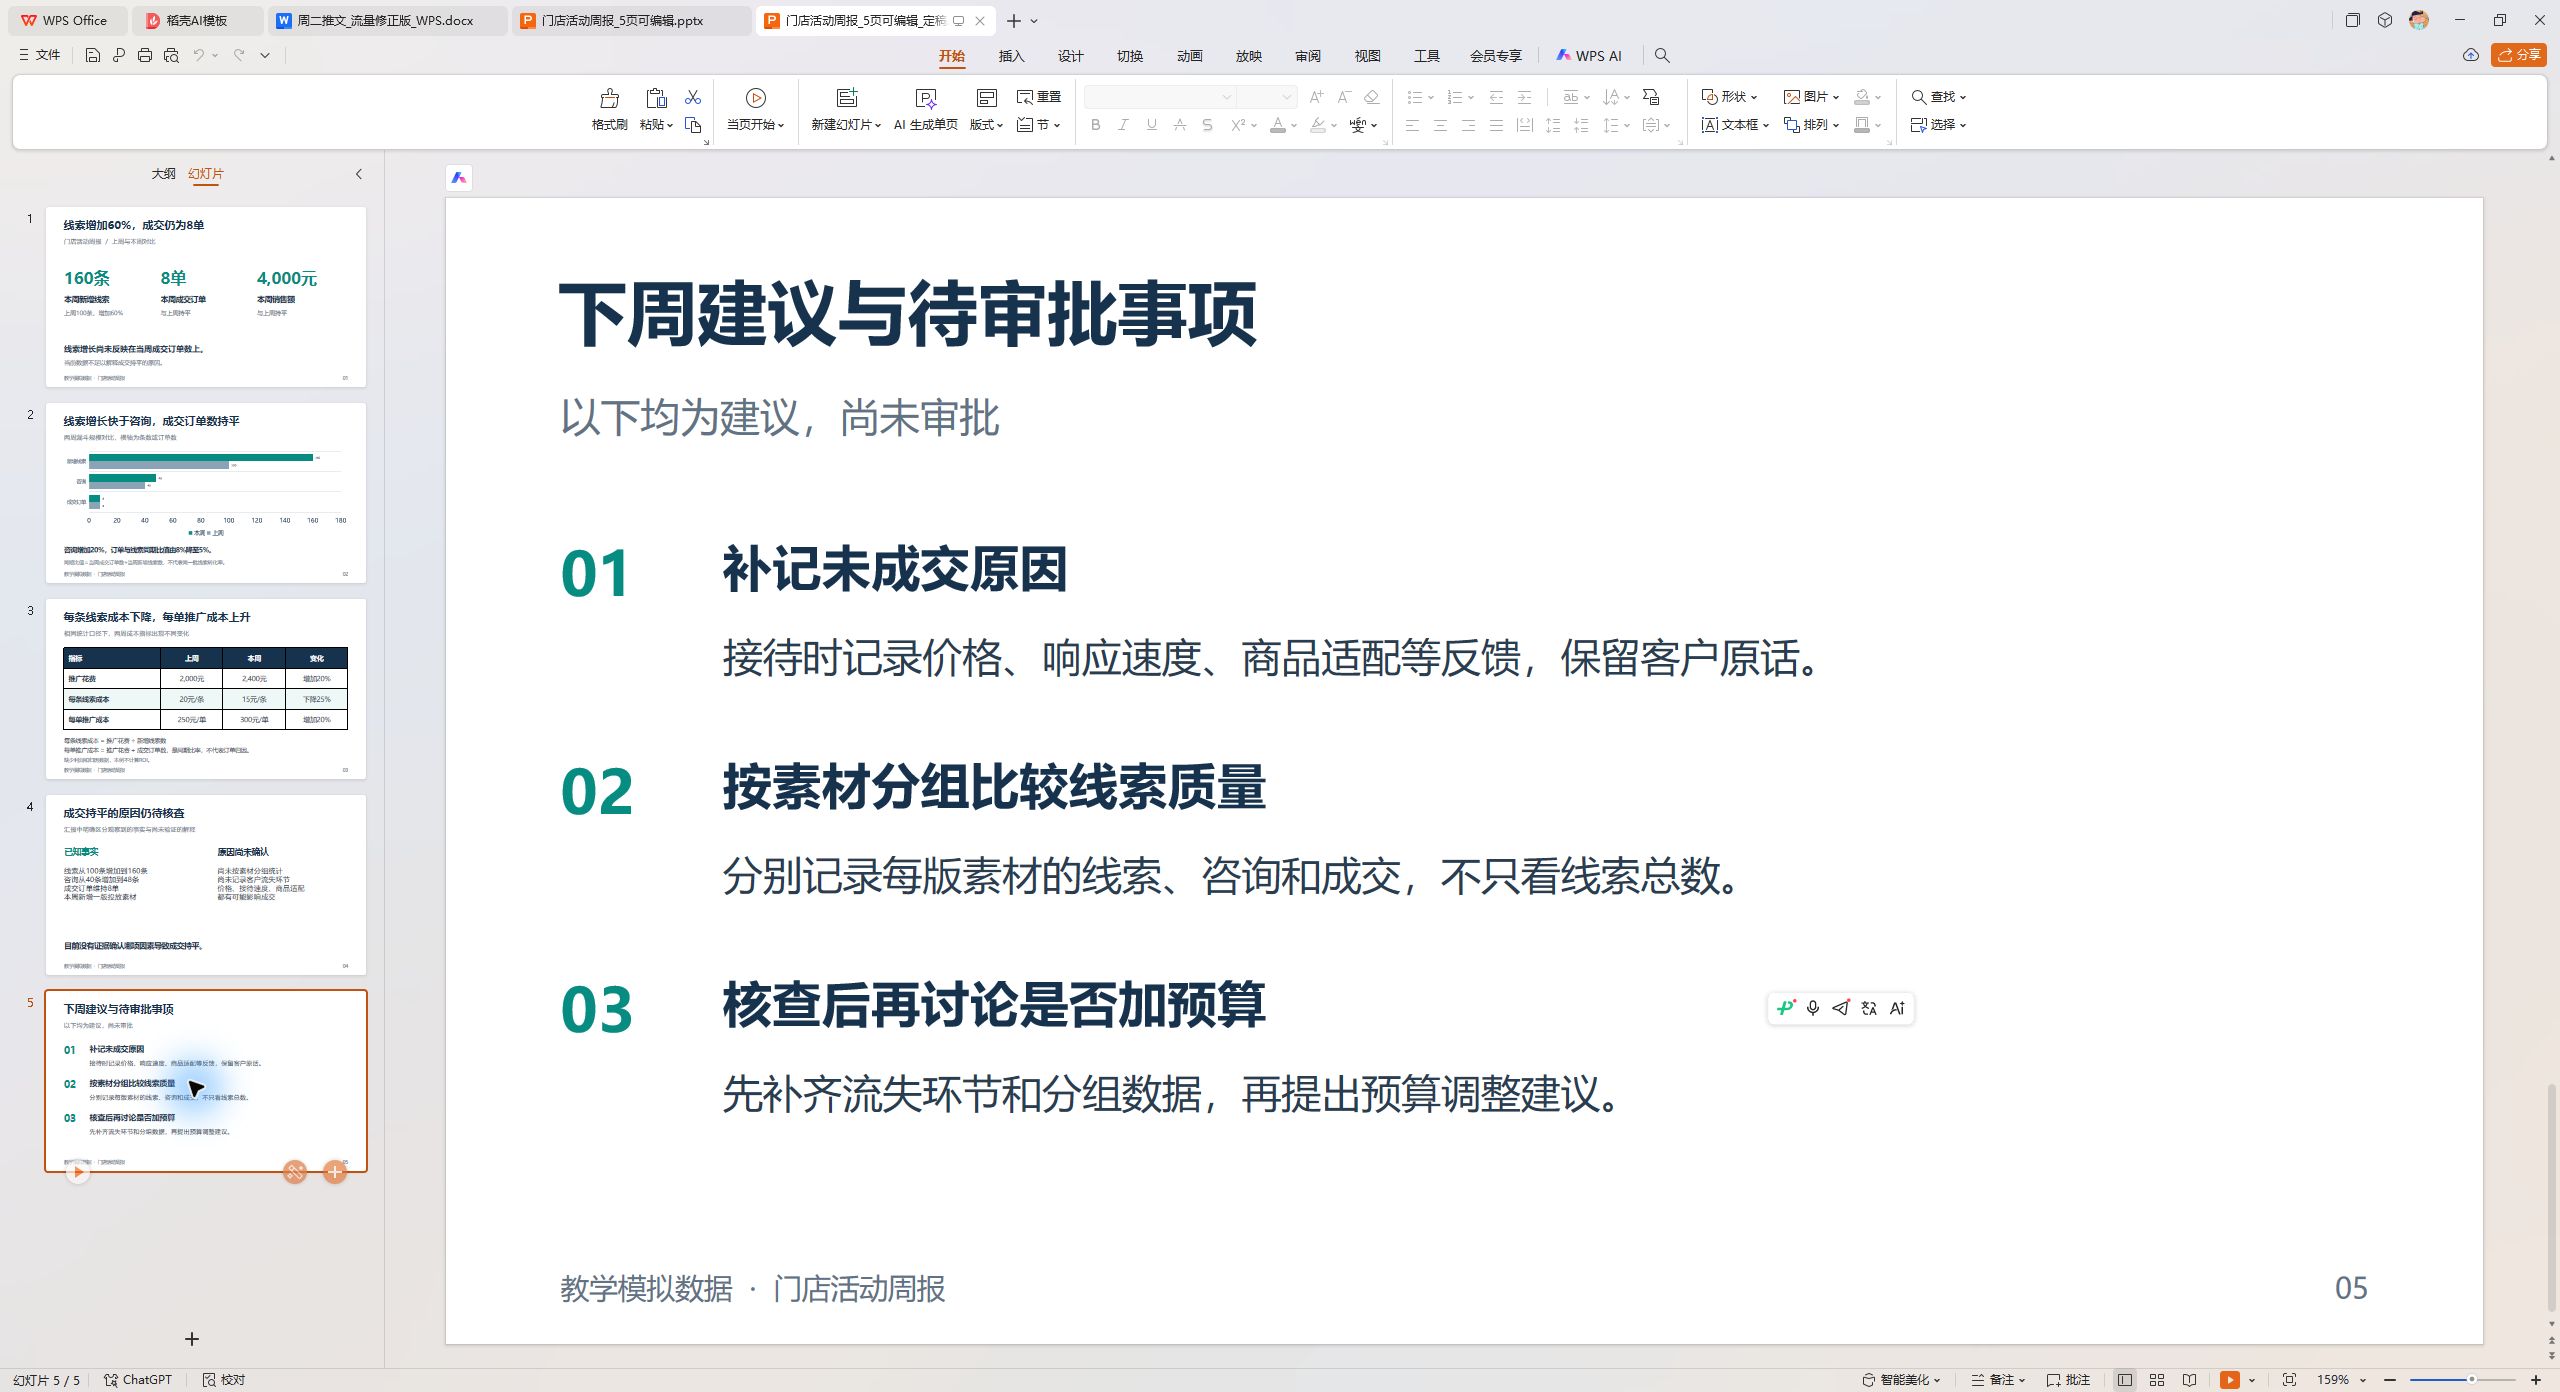
Figure 5 | Separating suggestions from approval status helps the person in charge decide next steps.
This PPT uses simulated data, with content and slide count pre-defined, so I don't promise "all reports can be done in minutes." No separate records for allocable expenses or manual baselines were kept, so time savings can't be calculated.
You can try this sequence with a worksheet you've already verified: State the question the report answers, confirm conclusions and outline, then generate an editable file.
After finishing, read the first slide. If it still just says "Work Summary," ask AI again: After reading this slide, which data-supported conclusion should the person in charge remember?
Data Realm Workshop | Case data is for educational simulation, PPT file was actually generated, images are screenshots from WPS operations.